Note: There is also a PDF version of this guide.
Use the three S’s (Wheelan 2010):
Significance: Is the relationship between the two variables strong enough to be statistically reliable? Check the p-value. For now, you can use this rule-of-thumb:
If p < 0.05: relationship is statistically significant; proceed to evaluating sign and size
If p > 0.05: results are indeterminate (you may skip sign and size)
Sign: Is the coefficient positive or negative?
Positive: as one variable increases, the other variable increases
Negative: as one variable increases, the other variable decreases
Note about odds ratios (sometimes reported instead of coefficients for non-linear models): odds ratio > 1 indicates a positive coefficient while < 1 indicates a negative coefficient
Size: How big is the (predictive) effect? This S is the most difficult, and you won’t always have enough information to evaluate it.
For linear models: A one-unit increase in the independent variable predicts a β-unit change in the dependent variable (where β is the coefficient)
For non-linear models: Interpreting the size is complicated; look for the authors’ explanation of effect size or “magnitude”
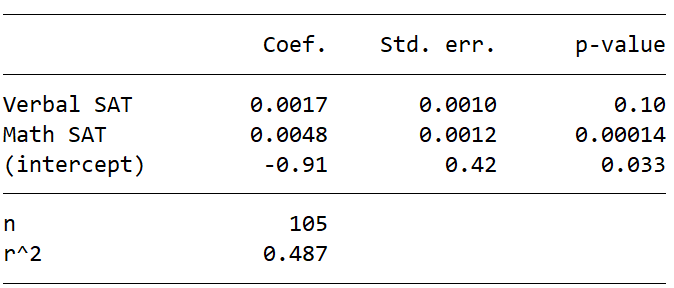
In Table 1, two independent variables representing students’ university entrance exam scores (verbal and math) jointly predict their university grade point average (GPA) in computer science classes (the dependent variable). We evaluate each independent variable with the three S’s:
Verbal SAT: The p-value (0.10) is greater than 0.05, so this variable is not statistically significant. This means we could not establish a reliable link between verbal SAT and computer science GPA. Maybe there is no link, or maybe we would need more data to detect it.
Math SAT: The p-value (0.00014) is smaller than 0.05, so math SAT is a statistically significant predictor of computer science GPA. The coefficient (0.0048) has a positive sign, so students with higher math SAT scores are predicted to have higher computer science GPAs. For size, a one-point increase in the math SAT (e.g., getting a 501 instead of a 500) predicts that the computer science GPA will be 0.0048 points higher. That seems tiny, but a one-point increase on an SAT is barely noticeable (and not actually possible if scores are always multiples of ten). In this case, it is better to consider an increase of 100 points, which requires multiplying the coefficient by 100. A 100-point increase in the math SAT (e.g., 600 instead of 500) predicts a computer science GPA that is 0.48 points higher (0.0048×100=0.48). This is nearly half a grade point higher and would be quite noticeable to most students. Thus, the size of predictive effect seems reasonably large.
Many publications don’t show exact p-values, instead using asterisks (*) to denote coefficients with p-values below 0.05 (and sometimes other thresholds).
Table 1 contains some additional information, including standard errors (easily transformed into margins of error), the sample size (n=105 students), and r-squared (describes how well the regression model overall explains values of the dependent variable).
The three S’s are just a starting point, but you have to start somewhere!
For more help learning statistics, check out my free textbook (minusthemath.com) or my YouTube channel (youtube.com/@minusthemath).
Data for the regression example comes from the OnlineStatBook: https://onlinestatbook.com/2/case_studies/sat.html
Reference:
Wheelan, C. (2010.) Introduction to Public Policy. New York: W. W. Norton & Company.


